Quarterly Report
Q1 2026
“Performance continues to be driven by stable operating income and active asset management across the portfolio.”
Dear Investors,
The Fund delivered 13.30% in total returns and 11.02% in realized returns for the quarter. Performance continues to be driven by stable operating income and active asset management across the portfolio. We are encouraged by the increase in acquisition activity during the quarter and the depth of our current pipeline, which positions the Fund to continue capitalizing on opportunities that have come during this market cycle.
We have a growing pipeline of properties under contract including Legends at Sparks Marina, a 421,479 square foot regional open-air shopping center located in Sparks, Nevada. The property is approximately 96% leased and serves as the leading retail and entertainment destination within the Reno-Sparks market and #4 in all of Nevada. We are currently in our due diligence period and expect to close this summer.
We have been pursuing the property for several years, and we are excited to have it under contract. It provides a very attractive combination of good in-place cash flow with in-place investor yields above 10%, while also being a stable asset that strengthens the overall portfolio. In addition, there is notable upside in the property. There are many legacy leases from the previous era. As those leases mature in the coming months and years, transitioning those leases to more favorable terms and structures will create significant value on top of the attractive in-place returns. Additionally, there are potential pad- sale/arbitrage and development opportunities.
For those considering an investment in the Fund, this represents a timely opportunity to participate. We encourage you to connect with our team to discuss this acquisition and the Fund more broadly.
During the quarter, we acquired six projects, including the purchase of a note secured by a property located in Billings, Montana. We have subsequently negotiated a deed in lieu of foreclosure and now have the title to the property.
We have generated tenant interest that provides flexibility in our leasing strategy and will create significant value in the asset as we lease space. This is a market that requires diligence, creativity, and relationships, and this project in particular reflects how the team works to create value for the portfolio and our partners.
The activity this quarter reflects the groundwork laid over the past year. While 2025 was lighter on acquisitions, we remained active in the market, and those efforts are now translating into awarded opportunities. Maintaining consistent engagement within the market continues to be a key differentiator.
Additionally, we executed on the sale of three cell towers, one at Orchard Pointe in the Denver Tech Center and two at Gainey Ranch in Scottsdale, Arizona, generating a profitable gain on sale and demonstrating our ability to unlock additional value across the portfolio.
Leasing activity across the portfolio (and across the broader market) has improved over the past several months, with increased tenant engagement and a growing number of executed leases. While the majority of activity in our suburban office portfolio continues to come from tenants in the 5,000 square-foot range, and built (spec) spaces, we are beginning to see larger users re-enter the market, which could represent meaningful upside over time. (See CoStar report on office leasing trends)
As discussed on our most recent manager call, late 2024 and 2025 represented the peak of lease rollover across the portfolio. That period has largely passed, and we are now focused on leasing vacant space. Early traction has been positive, and we are encouraged by the momentum.
Interest rates remain our most significant headwind, however we are not unique in our position and as rates continue to pressure the market, it will create buying opportunities that the Fund is uniquely positioned to take advantage of due to our portfolio, relationships and team.
We look forward to continuing to build on this momentum and appreciate your continued trust and partnership.

Travis Barney, Chief Executive Officer
Alturas Capital Partners, LLC

Devin Morris, Chief Operating Officer
Alturas Capital Partners, LLC

Blake Hansen, Chief Investment Officer
Alturas Capital Partners, LLC

Photo: Idaho
Q1 Key Numbers
13.30%
Average Total Return
11.02%
Average Realized Return
$6.77M
Realized Net Income
$1,690.59
Unit Price
$732.13M
Assets Under Management
*Stated returns are average annualized investor returns. Individual investor returns may vary based on the unit pricing at the time of investment. Realized net income includes realized gains and losses and excludes unrealized gains and losses recorded during the period. Financial information herein related to the quarters ended in 2026 are unaudited as of the date of this report.
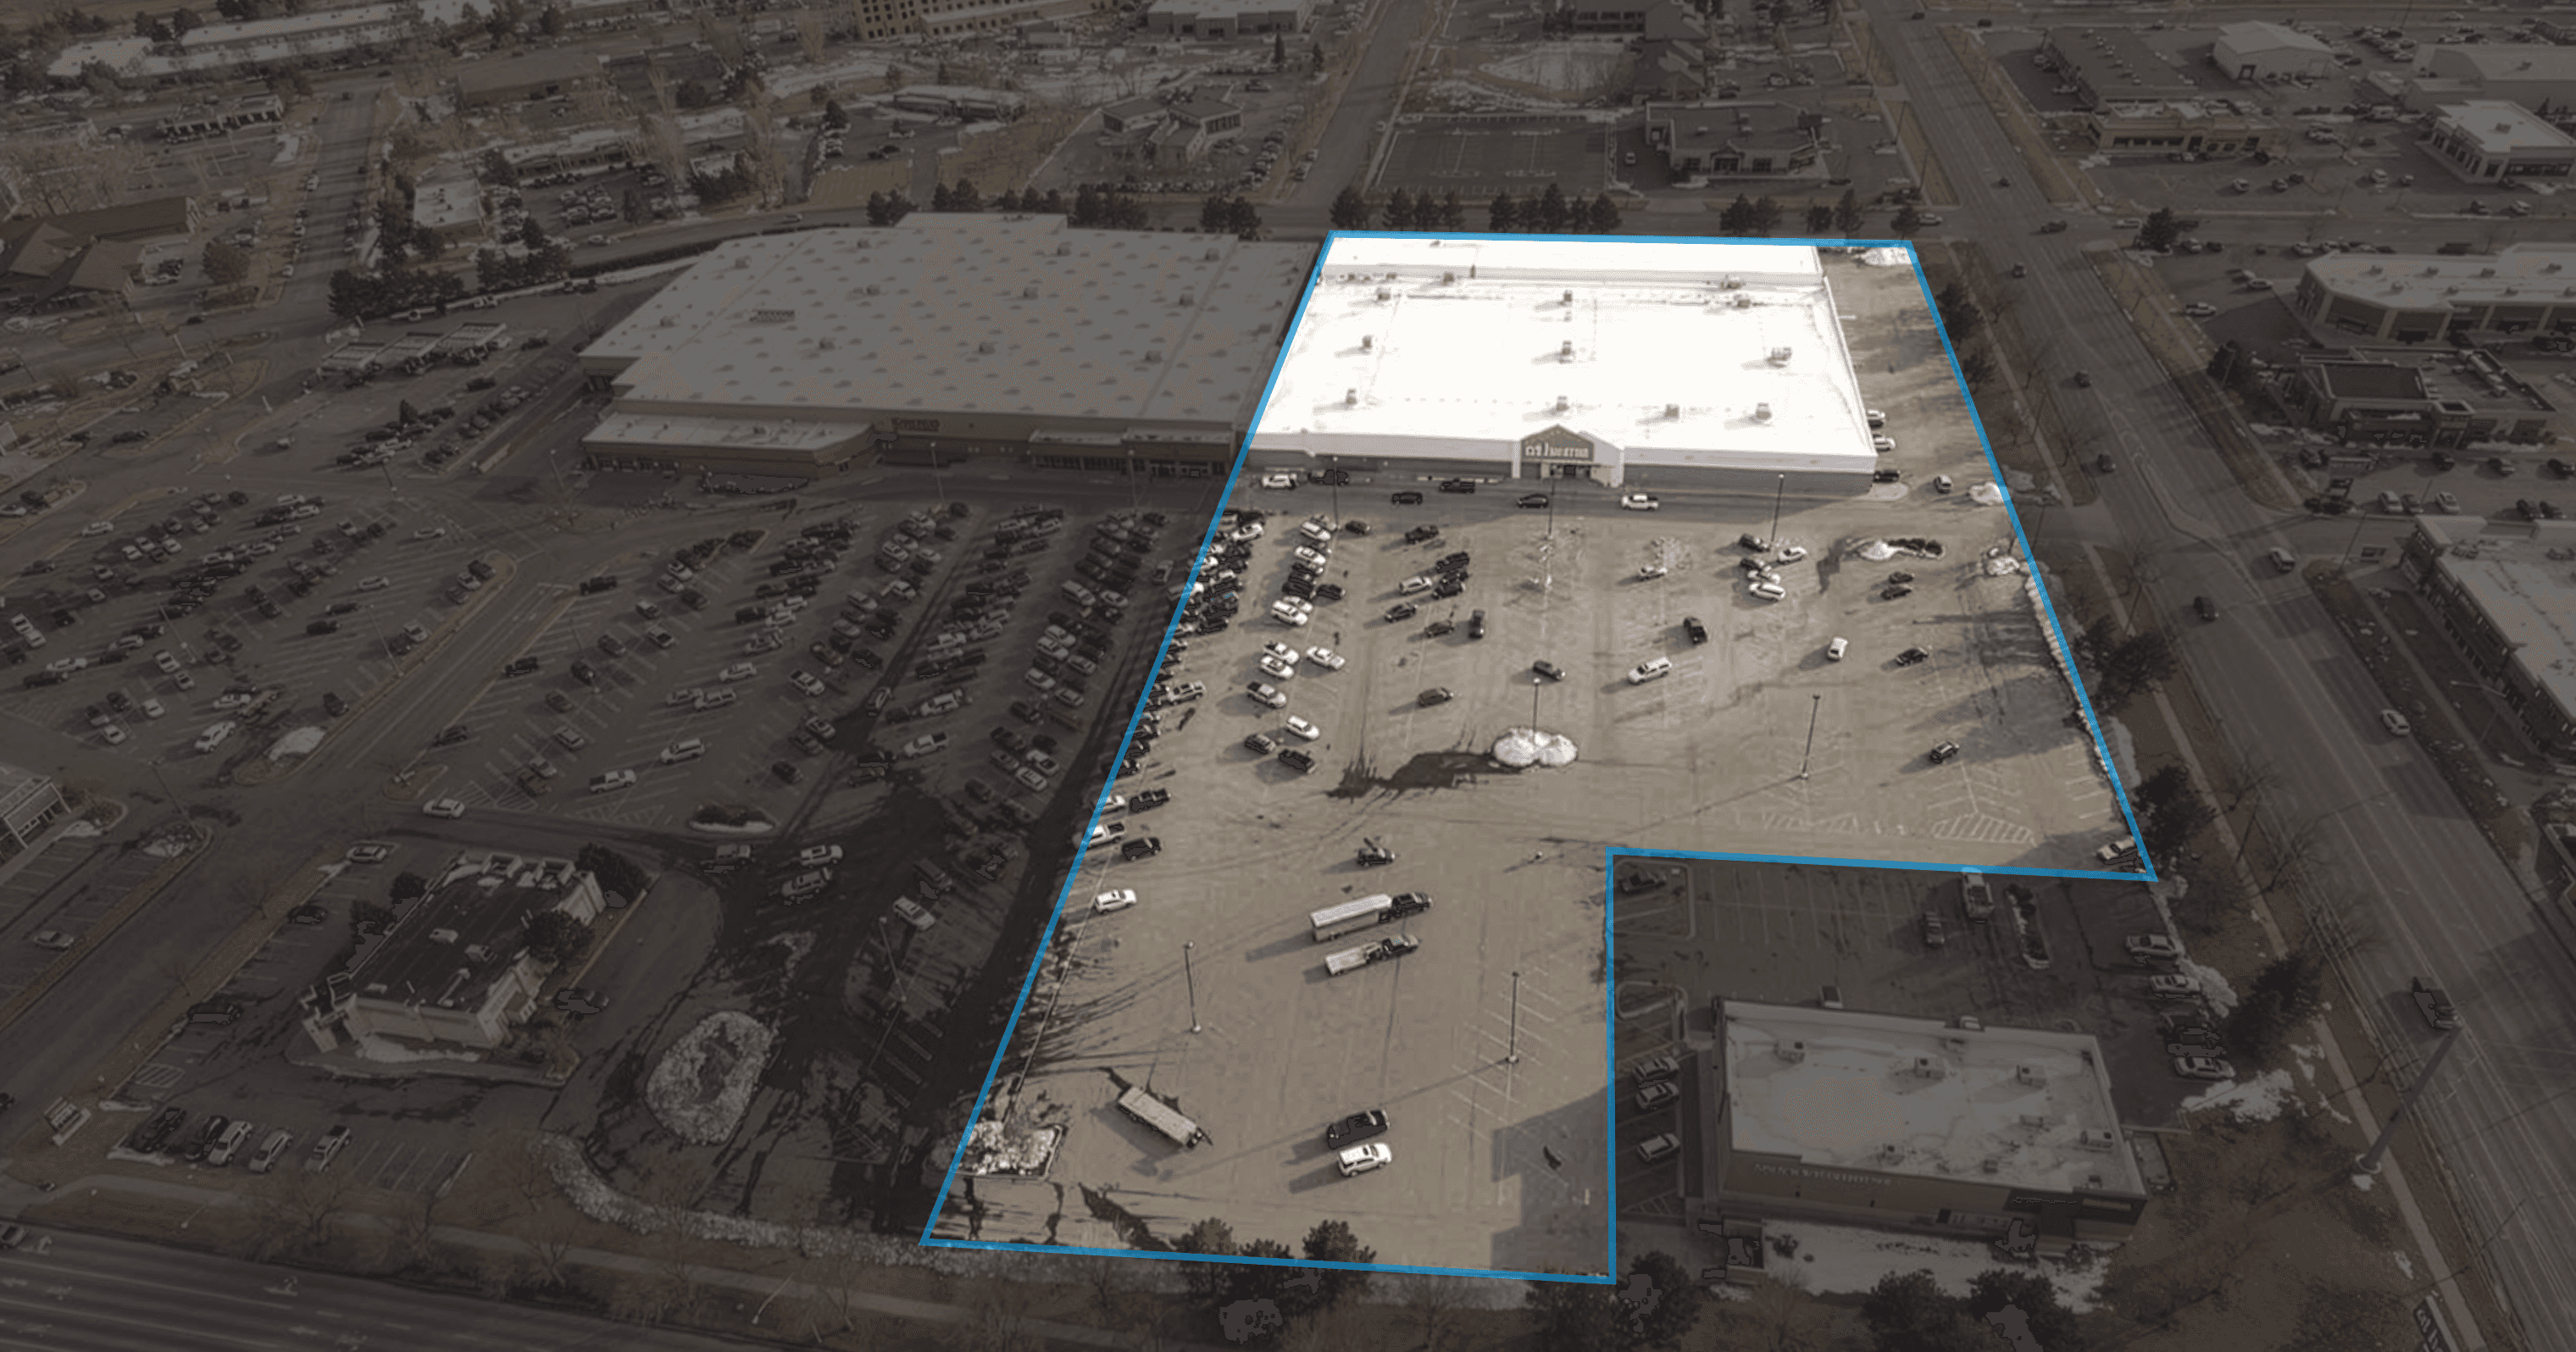
Legends at Sparks Marina
Lifestyle Retail Center
Property Type
421,479
Square Feet
8+
In Place Cap Rate
We see a rare combination here — durable in-place cash flow, a clear and credible path to NOI growth as below-market legacy leases convert to market-rate NNN structures, and meaningful optionality through pad sales and development, all underwritten by the center's dominant and defensible position in the Reno-Sparks market.
Legends at Sparks Marina is a 421,479 square foot open-air lifestyle and entertainment center located in Sparks, Nevada, approximately 96% leased and anchored by tenants including Scheels, Target, Burlington, Galaxy Theatres (with the area's only IMAX), and H&M. The property ranks #1 among shopping centers within 15 miles and #4 statewide, drawing nearly 12 million visits annually.
Following our visit to the property, we are encouraged by the momentum on the ground. A high-end restaurant destination is currently under construction and will be opening this spring, with additional lifestyle-oriented tenants expected to fill vacancies, further elevating the center's retail and dining experience.
The Reno-Sparks market continues to benefit from strong population and employment growth, driven by major employers including Tesla, Amazon, and Google, with over 430,000 residents within 10 miles, and no state corporate or personal income tax. Nearby hotel developments under construction will add foot traffic, though the center's performance is fundamentally supported by the local economy rather than tourism.
Value-Add Strategy
The center carries a legacy of gross leases, percentage-rent leases, and gross-plus-percentage rent leases. In-place rents average approximately $21 per square foot, while current market rents are approaching $40. New and renewing tenants are signing NNN leases at market rates. As those legacy leases roll over the next several years, NOI is projected to grow meaningfully. Recent lease signings validate that thesis, and there is no comparable lifestyle product planned in the near term, reinforcing the center's dominant position in the market. The project fits the same investment philosophies we have always pursued: durable, well-located cash flow with a credible path to NOI growth.
Additionally, there are pad-sale and ground-up development opportunities that will be additional avenues for value creation.
We believe this offers a compelling opportunity to invest in a high-quality, cash-flowing asset with embedded upside. As we continue to work through our due diligence, we invite interested investors to reach out.


Photo: Boise River, ID
Q1 Acquisition Pipeline

Legends at Sparks Marina
Sparks, NV
Retail
420,165 SF
Core

1425 Broadway
Boise, ID
Retail
950 SF
Build-to-Suit

Idaho Fitness Factory
Kuna, ID
Retail
12,000 SF
Build-to-Suit

2727 State
Boise, ID
Retail
5,064 SF
Build-to-Suit

Photo: Idaho
Tax Update
13.22%
2025 After-Tax Return
$2.00M
2025 Federal Taxable Loss
The Fund’s pre-tax average annual return was 12.43%, and after-tax the estimated average return was 13.22%, assuming a blended rate of 37% on ordinary income and 20% on capital gains. This was largely due to $2 million of federal taxable losses in 2025, resulting in minimal federal tax liability for most investors.
This outcome was driven by cost segregation studies on select assets and the identification of expenditures that, while capitalized for GAAP reporting, were eligible for immediate deduction for tax purposes. The Fund also benefited from bonus depreciation, with rates varying based on asset placement timing under current tax law.
We remain deliberate in balancing near-term tax benefits with the long-term impact on investor capital accounts. The Fund’s evergreen structure supports sustained tax efficiency by allowing the portfolio to continuously incorporate new assets with fresh depreciation, which can offset taxable income generated by more seasoned holdings over time. We continue to work closely with our tax advisors to extend these benefits while maintaining discipline across the portfolio, recognizing that certain states, do not fully conform to federal bonus depreciation rules.
Tax efficiency remains a central focus of our investment strategy, and we will continue to manage the portfolio with an emphasis on optimizing after-tax outcomes for our partners.
*Returns are average annual returns. Actual returns for each investor will vary based on the unit price paid for units held.
**Assumes all investors pay an average blended federal tax rate of 37% on ordinary income and 20% on capital gains and excludes the impact of state income taxes. Actual tax rates will vary for each investor. We recommend consulting with your personal tax advisor to understand the various federal and state income tax implications associated with investing in the Fund.

Photo: Western Peaks, Idaho
Q1 Acquisitions

Walgreens
Idaho Falls, ID
Retail
14,280 SF

Take 5 - Kuna
Kuna, ID
Retail
1,400 SF

11101 Overland
Boise, ID
Retail
4,900 SF

Idaho Fitness Factory - Star
Star, ID
Retail
12,000 SF

7802 W Overland Road
Boise, ID
Retail
3,387 SF
905 S 24th Street
Distressed Note Purchase
Billings, MT
Retail
100,800 SF

Photo: Sawtooth Mountains, Idaho
Q1 Dispositions

Gainey Ranch Town Center Cell Towers (Partial Sale)
Realized Gain: $589,000
Phoenix, AZ

Orchard Pointe Cell Tower (Partial Sale)
Realized Gain: $273,000
Denver, CO
Current Investments
83.51%
Occupancy Rate
89.02%
Lease Rate
4.14M SF
Total Square Feet
1.81x
Debt Service Coverage Ratio
$251.19M
Investor Capital
43.62%
Current Reinvestment Rate
Markets
Property Types
Above charts are based on contributed capital.
All projections are hypothetical and predicated upon various assumptions that may or may not be identified as such. The future operating and financial performance information contained herein is for illustrative purposes and is not intended to portray any sort of targeted or anticipated returns. There can be no assurance that the Fund will achieve its investment objectives and actual performance may vary significantly.
Alturas Capital Partners, LLC and its affiliates do not provide tax, legal or accounting advice. This material has been prepared for informational purposes only, and is not intended to provide, and should not be relied on for tax, legal or accounting advice.