Dear Investors,
For the second quarter, the Fund delivered 12.36% in total returns and 10.28% in realized returns. We remain encouraged by the underlying performance of the portfolio and the momentum we continue to see across our operating platform.
As this report is being released, we're pleased to share that early in the third quarter, the Fund closed on Legends at Sparks Marina, a 421,479-square-foot lifestyle center and the leading shopping, dining, and entertainment destination in the fast-growing Reno-Sparks market. It's a diverse, high-quality asset with durable in-place cash flow and real room to create additional value through our hands-on management. While this acquisition closed after quarter-end, we see it as one of the most significant additions to the portfolio this year and a strong signal of the opportunities we continue to find in the market.
We have additional projects in the pipeline (see Acquisition Pipeline below), and there is still capacity in this capital raise for both new and existing investors. If you are considering an investment in the Fund, or increasing your current position, we would welcome the opportunity to connect.
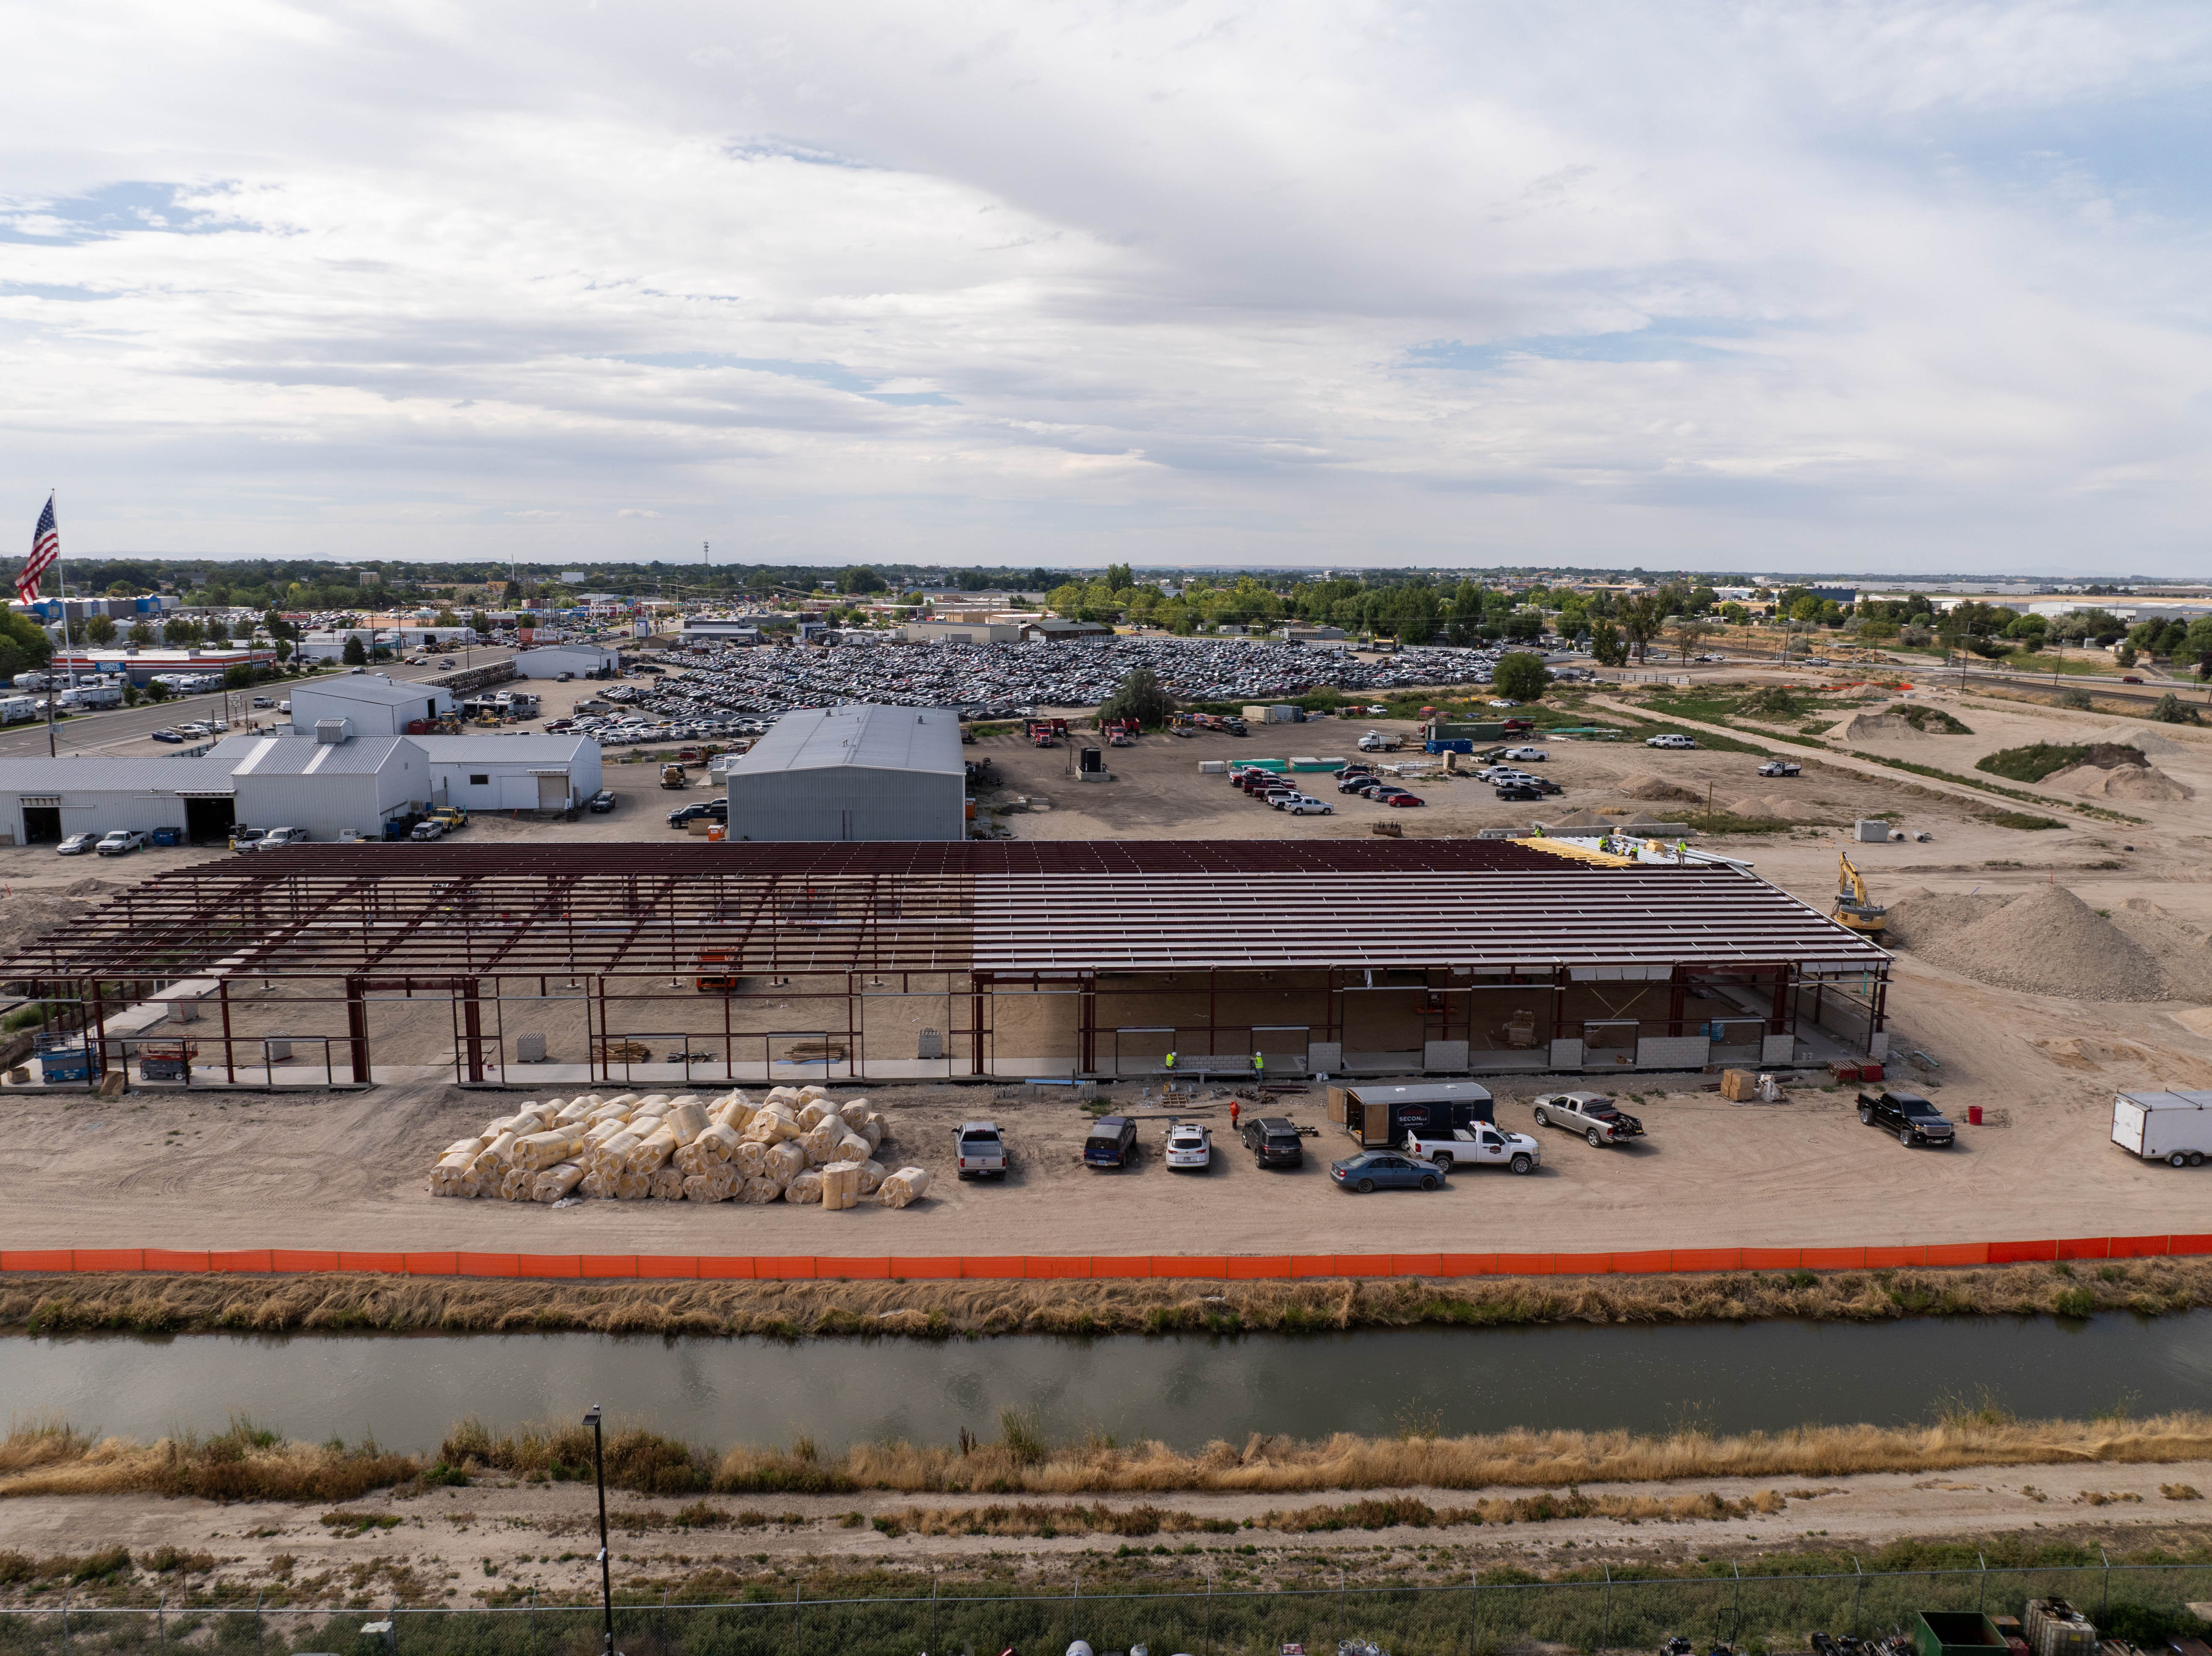
During the quarter, we closed on two new development projects and reached an important milestone in our Billings, Montana retail investment. The Fund had originally acquired the secured note on the property with the goal of taking control of the underlying real estate, and during the quarter we completed the deed-in-lieu of foreclosure process, taking outright fee simple ownership of the asset. We have a signed LOI from a national credit tenant for the majority of the building, with several other credit tenants interested in the remaining space. This is a good example of our team's ability to source and execute more complex opportunities where a differentiated approach creates long-term value for our partners.
Leasing activity remains strong across our office, industrial, and retail portfolios. While many of these leases will contribute to operating income over the coming quarters as tenant improvements are completed and rents commence, the progress this quarter further strengthens the long-term outlook for the portfolio. Here are two noteworthy examples:
We were able to successfully negotiate a lease extension for a major tenant located at our Westpark property that grew annual rent by approximately $200,000 or 30%. For additional context, at a hypothetical 6.5% cap rate, this equates to approximately $3.1 million in additional value.
At White Mountain, our retail center in Rock Springs, WY, we leased previously vacant space to Natural Grocers who took occupancy this quarter. We’ve also leased the adjacent space vacated by JoAnn’s to a national credit tenant that is paying a higher rental rate and a stronger use, with occupancy expected next quarter.
A decade of disciplined investing has produced a cash-flowing portfolio with substantial embedded value, and we see opportunities to selectively monetize mature investments and redeploy capital into opportunities offering stronger long-term risk adjusted returns. In a higher-rate environment, we expect returns from operations to contribute a smaller proportion of overall returns than it has historically. That will make quarter-to-quarter results less consistent, but it reflects the portfolio reaching a stage where we can convert years of value creation into results for our partners and maintain high risk adjusted returns relative to the market.
We look forward to building on this momentum through the remainder of the year.

Travis Barney,
Chief Executive Officer
Devin Morris,
Chief Operating Officer

Blake Hansen,
Chief Investment Officer

Daniel Trevino,
Director of Investor Relations
Q2 Key Numbers
12.36%
Average Total Return
10.28%
Average Realized Return
$6.36M
Realized Net Income
$1,698.72
Unit Price
$745.88M
Assets Under Management
*Stated returns are average annualized investor returns. Individual investor returns may vary based on the unit pricing at the time of investment. Realized net income includes realized gains and losses and excludes unrealized gains and losses recorded during the period. Financial information herein related to the quarters ended in 2026 is unaudited as of the date of this report.


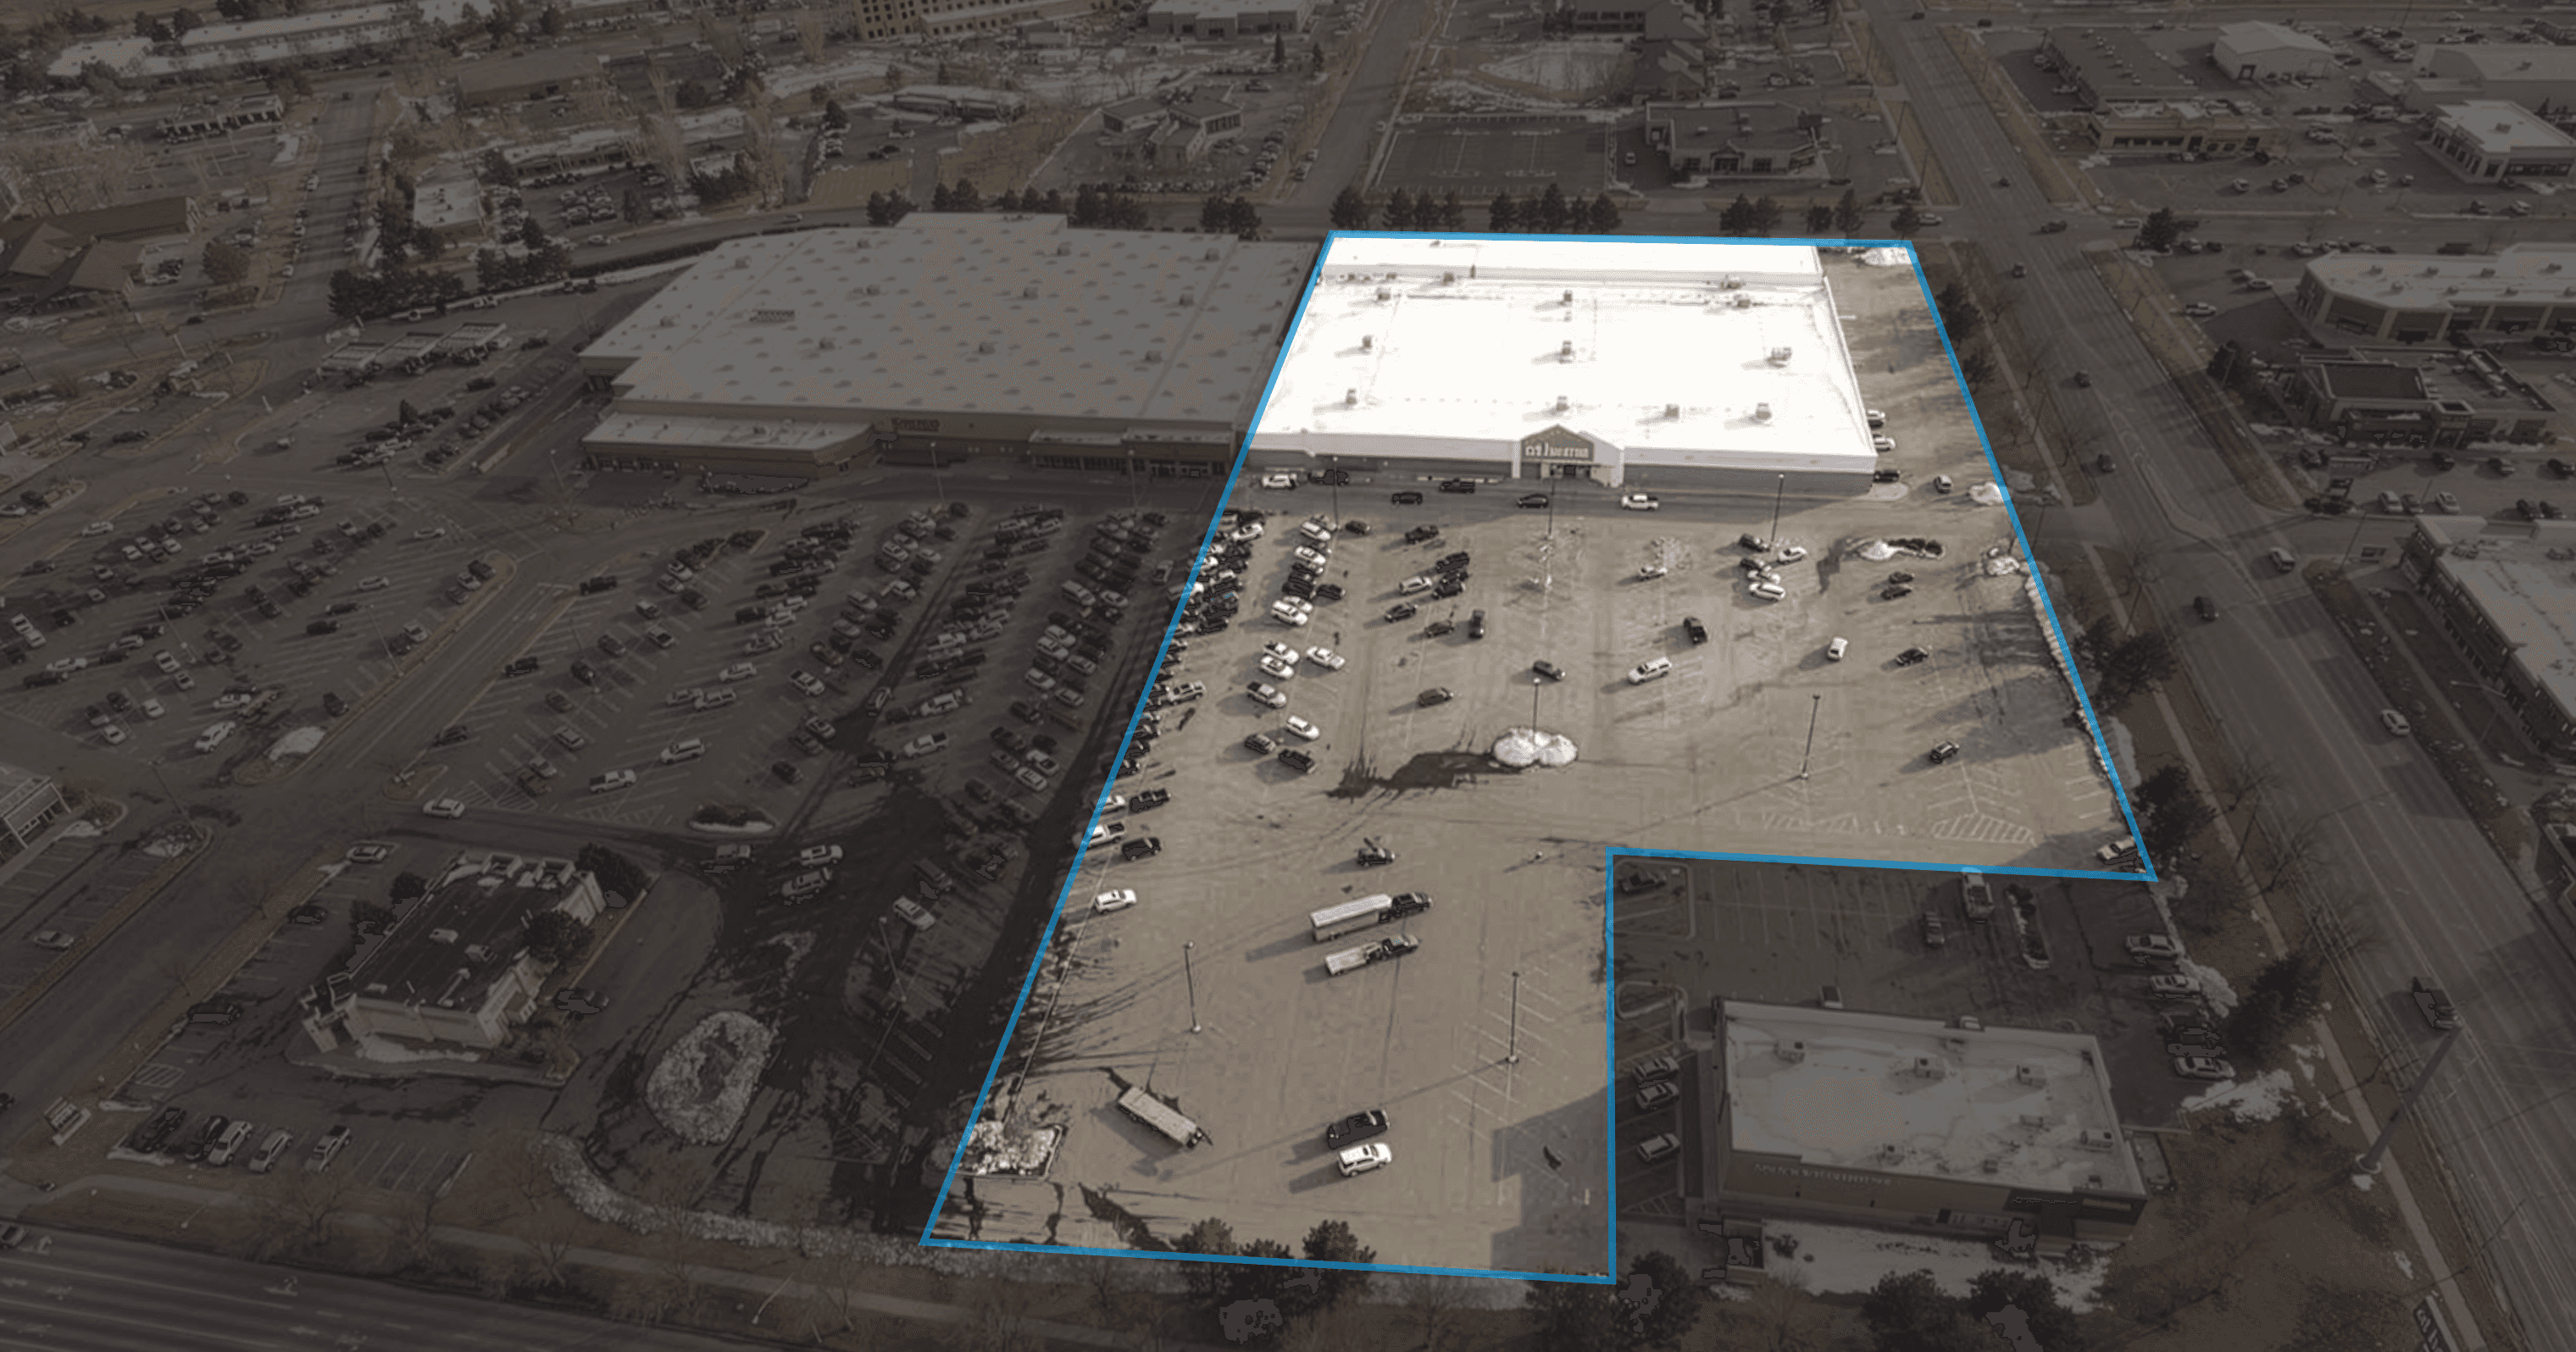
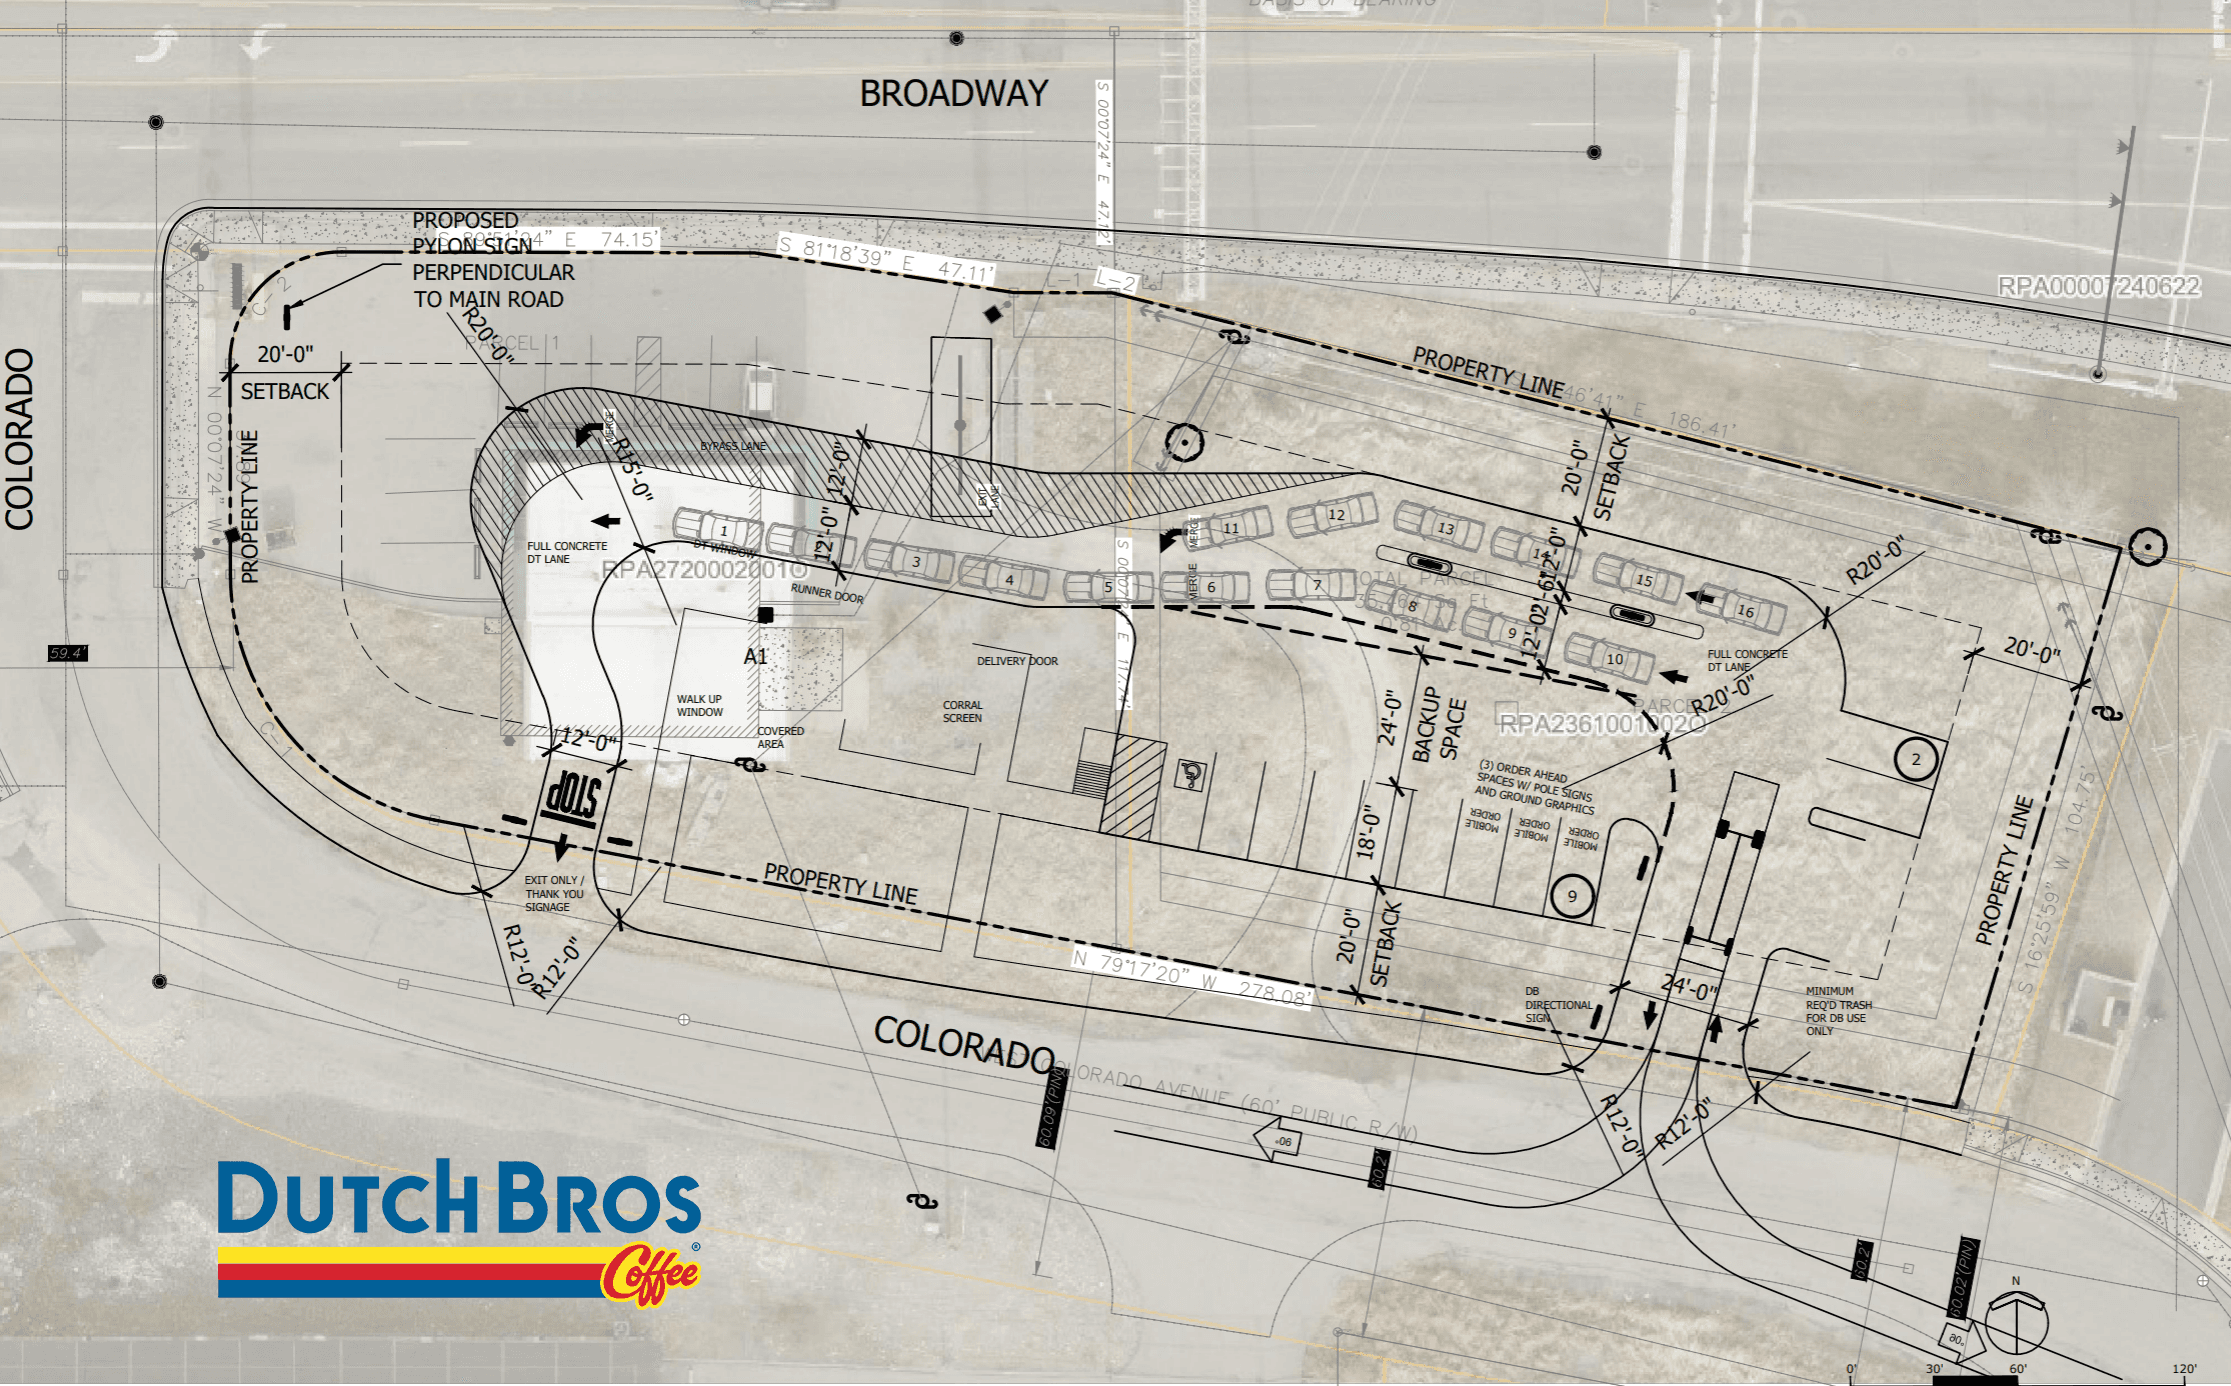
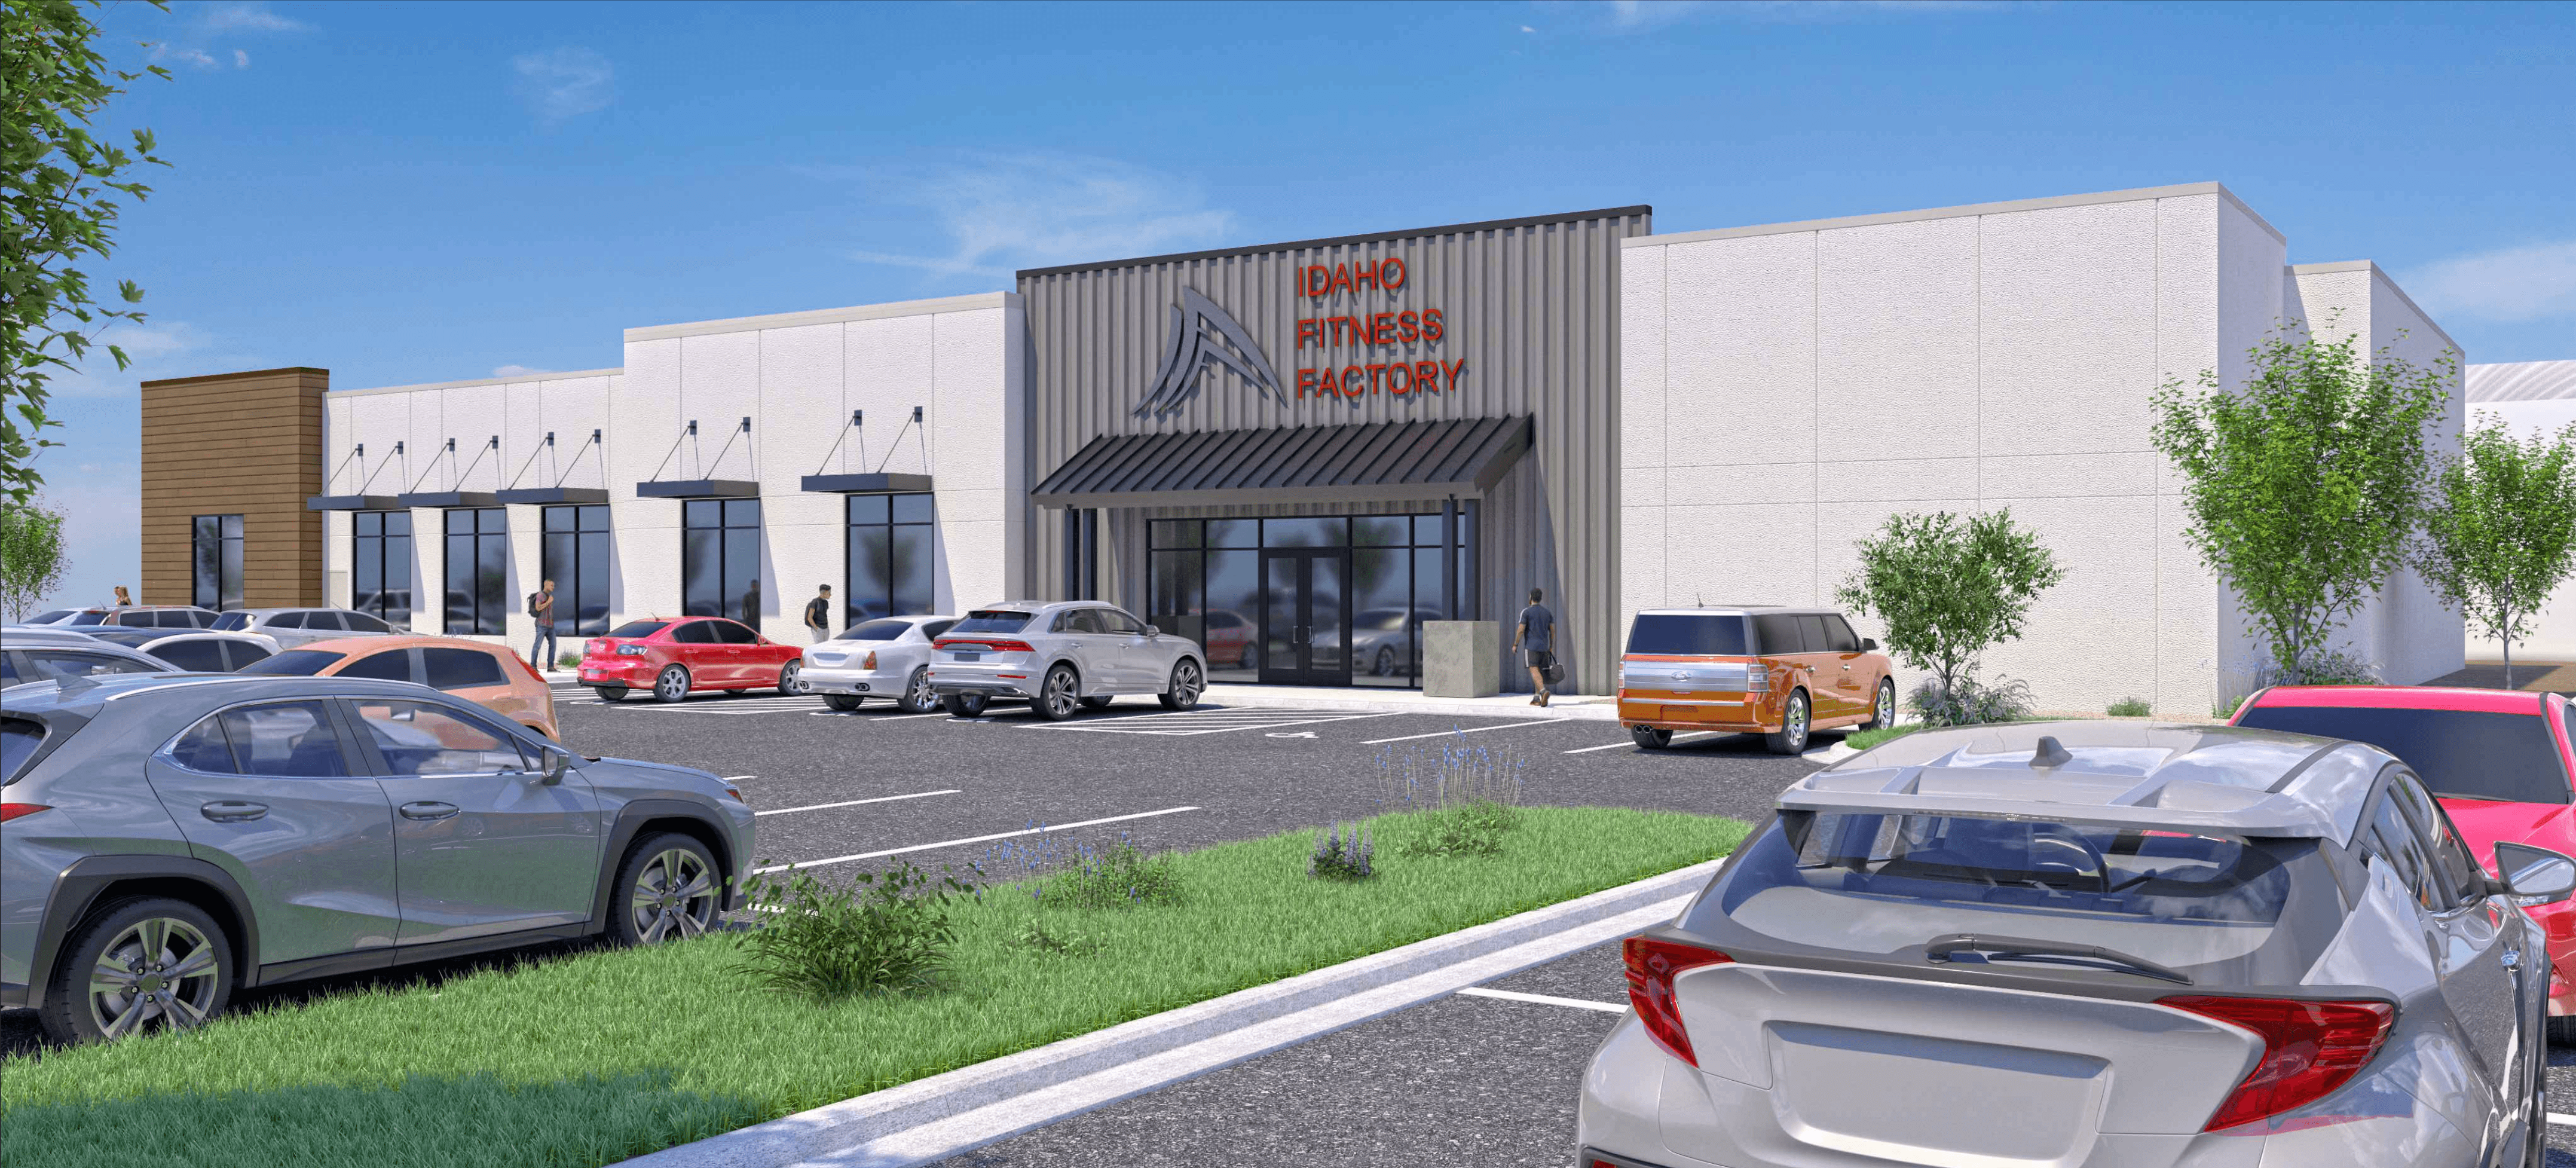


Legends at Sparks Marina
Sparks, NV
Retail
421,479 SF
Core

1880 14th Avenue
Albany, OR
Retail
39,213 SF
Value Add

5345 S 4015 W
Taylorsville, UT
Retail
57,574 SF
Value Add

36th Street Garden Plaza
Boise, ID
Office
15,918 SF
Value Add





Current Investments
50
Properties
84.12%
Occupancy Rate
88.89%
Lease Rate
4.05M SF
Square Feet
1.77x
Debt Service Coverage Ratio
$267.59M
Investor Capital
47.49%
Reinvestment Rate

Diversification by Market
Diversification by Tenant Industry
Diversification by Property Type

All projections are hypothetical and predicated upon various assumptions that may or may not be identified as such. The future operating and financial performance information contained herein is for illustrative purposes and is not intended to portray any sort of targeted or anticipated returns. There can be no assurance that the Fund will achieve its investment objectives and actual performance may vary significantly.
Alturas Capital Partners, LLC and its affiliates do not provide tax, legal or accounting advice. This material has been prepared for informational purposes only, and is not intended to provide, and should not be relied on for tax, legal or accounting advice.